October 9, 2026
AI Relief Tests US30 Durability Amid Narrow Breadth
AI revenue updates have eased valuation fears and lifted futures, yet the rally's extreme narrowness—with equal-weight ratios at 2003 lows—leaves the...

Created by Emmanuel N Justine
US30 technical analysis and market news for intraday, swing, andshort -term traders
Explore the latest content tracked by US30 Market Pulse
AI revenue updates have eased valuation fears and lifted futures, yet the rally's extreme narrowness—with equal-weight ratios at 2003 lows—leaves the...
Tech-driven gains lift US30 to 51,512.20 as AMD, Marvell and Broadcom rally, supported by pausing yields.
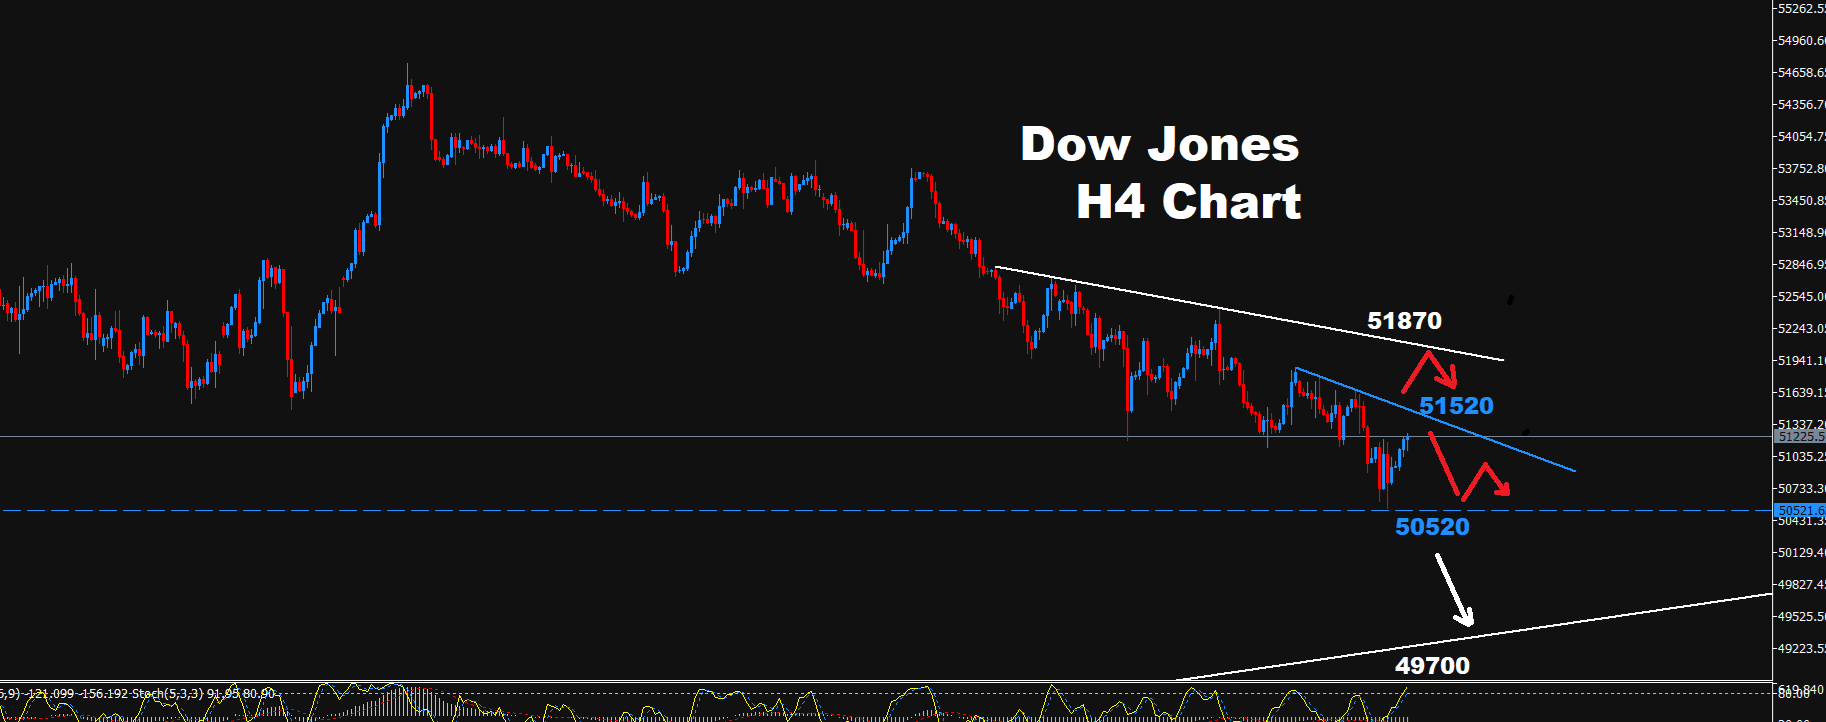
Dow hit the 50,520 downside target and is now testing nearby resistance.
Weakening participation across banks, small caps and bonds signals air pocket risk beneath major indices.
Dow futures slipped 0.07% to 51,440 as Middle East tensions offset softer Fed expectations. This keeps price inside the 51,100-51,500 support zone, suggesting geopolitical risk is currently dominating any relief-bounce impulse for now.
Will US30 open higher despite Iran’s Strait of Hormuz standoff?
Dow Inc. fell 1% to $27.61, outpacing the S&P 500's 0.17% decline.
Global risk-off pressures are building from elevated yields and crude prices, with Asian indices falling sharply and US futures signaling further...
Support and resistance function as zones rather than exact lines, with prices rarely reversing at the precise number and instead reacting within 1–3% bands.
This week's technical review frames US30 trading around Dow trend direction, support/resistance, and volatility signals, with confirmation from Nasdaq, Russell, VIX, yields, DXY, and crude oil.
Iran’s fracturing proxy network adds uneven escalation risks that could keep oil prices volatile and weigh on US30 risk sentiment.
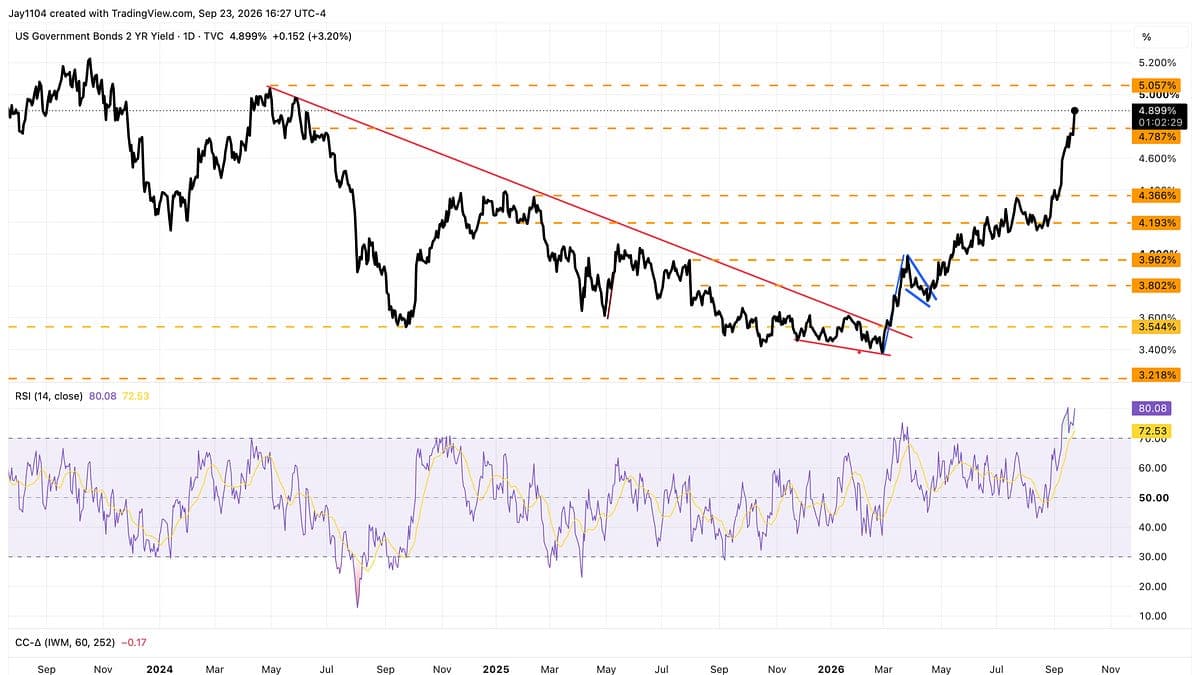
Can the Dow's rally near 51,828 withstand the 10-year yield at 5.17% and climbing rate pressure?
The M5 EMA9 Push model uses a clean higher low on the 5-minute chart against hourly context to initiate trend and define risk.
DIA ended at 517.49 with a 0.9% advance on 2.7 million shares, marking a constructive close for US30 short-term trend and setting the immediate reference for support/resistance levels.
Historical patterns point to an average 19.8% S&P 500 total return in the nine months after midterms, with positive results in 92% of cycles, driven...