May 25, 2026
Grids Scaffold Visual Thinking
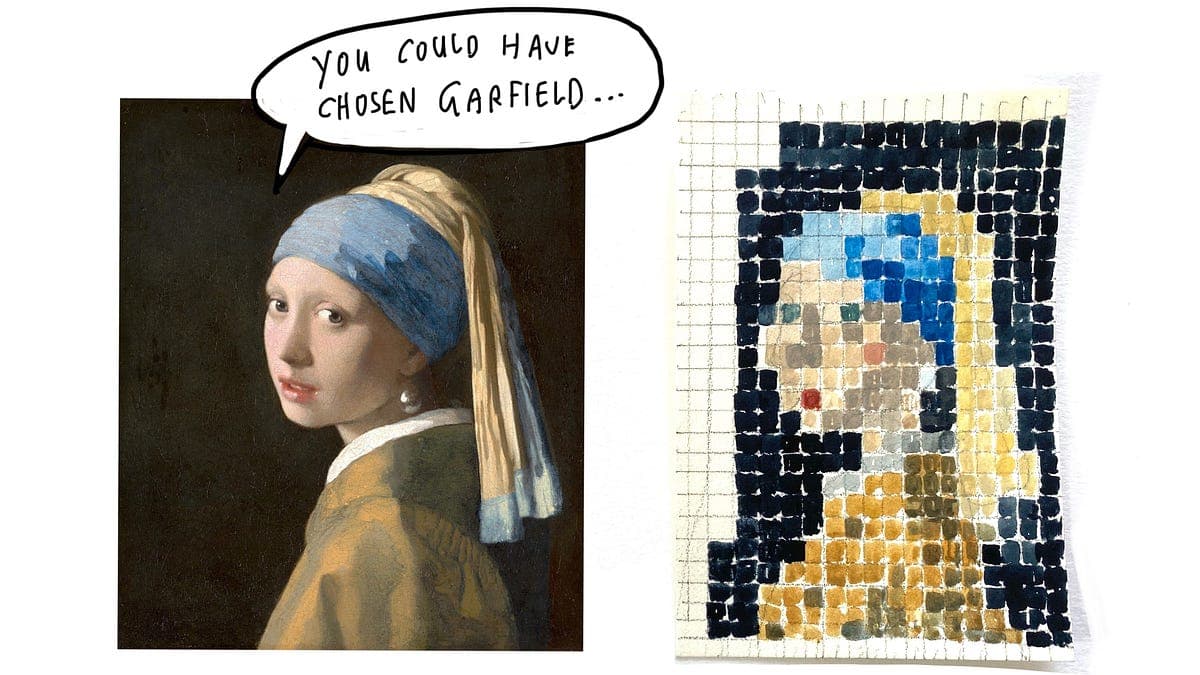
Diego Rivera's mosaic proposals on graph paper show how grids break complex scenes into modular squares, letting artists plan composition and scale...

Created by tao hong
Academic studies and industry insights on drawing, diagrams, and visual tools shaping cognition
Explore the latest content tracked by Visual Cognition Lab
Diego Rivera's mosaic proposals on graph paper show how grids break complex scenes into modular squares, letting artists plan composition and scale...
Abacus AI now converts rough sketches into full app journeys and consistent animations while handling planning and error states. This cognitive...
Draw2Think wraps frozen VLMs in a Propose-Draw-Verify loop with GeoGebra, letting models externalize hypotheses onto a constraint-checked canvas that...
Neuroscientist Vivienne Ming warns that AI risks creating cognitive zombies by enabling passive outsourcing of thought and decision-making. She...
When AI handles the thinking and you simply copy and paste, your own pedagogical reasoning slowly atrophies. Recognizing this danger calls for deliberate overcorrection through active human engagement in education.
Children's drawing progresses through four key stages from ages 3 to 12+, revealing how they build and use symbolic representations for expression and...
AR drawing tools let artists work in a more natural and focused way by removing the need to pause and measure, helping preserve concentration and flow during the creative process.
Service blueprints map frontstage customer interactions against backstage processes, yet remain frozen snapshots that fail to encode temporal flow or...
AI is rapidly lowering barriers to professional visual creation for research and learning.
UML activity diagrams act as a structured diagramming system to clarify complex processes, as illustrated by modeling a word processing workflow that...
A tree structure diagram serves as an external cognitive tool that systematically organizes the complete evolution of AI from theoretical beginnings to its current state, making complex historical knowledge easier to grasp and communicate.
Learners benefit from images, diagrams, and spatial organization such as charts, mind maps, and color coding because their brains rely heavily on occipital lobe function. This brain-aligned approach supports more effective learning outcomes.
The RCM Decision Diagram provides a structured process for evaluating each failure mode from FMEA to classify its effects as evident or hidden during...
The MemEye benchmark introduces a visual-centric framework for testing how multimodal AI agents preserve and reason over visual evidence. This...